
Why You’re Here (and What This Solves)
Affiliate networks and brands today are flying blind: many tracking platforms give raw data and rigid reporting capabilities, but few insights and answers. Reporting takes hours. Identifying high-value affiliates or profitable offers depends on gut instinct or spreadsheets. Meanwhile, conversion rates tank overnight, affiliate domains get blacklisted without warning, affiliate fraud drains budgets, and revenue leaks through poor-performing partners, all while AM teams stay stuck in reactive mode.
In this guide, we’ll walk you through:
- The key data problems affiliate networks face
- How analytics fixes them (with examples)
- How to build your own Business Intelligence pipeline (if you’re technical)
- Why platforms like CatStats offer a faster, smarter alternative
Part 1: Why Data Analytics Matters in Affiliate Marketing
Missed Revenue Is the Norm, Not the Exception
Most affiliate networks lose 40%-50% of potential revenue due to poor tracking, great offers having low visibility, and an inability to stay on top of legitimate, clean affiliate traffic.
When you’re not measuring the right things, you can’t optimize. That leads to:
- Offers that never scale because the right affiliates never receive them
- Affiliates that churn because they aren’t credited for the conversions they drive
- Budgets wasted on low-ROAS campaigns
- Conversion rate drops that go undetected for days
- Domain bans that kill traffic overnight with an inability to substitute traffic fast enough
- Affiliate fraud that drains margins before detection
Part 2: The Common Problems (and Analytics-Based Fixes)
Problem 1: You are Drowning in Data When You Actually Need Insights
Symptom: The tracking platform you are using is offering various reporting methods like tables and pivot tables, but you're still left guessing what’s actually going on. It is difficult to stay on top of critical things and performing detail investigations takes a large part of your time.
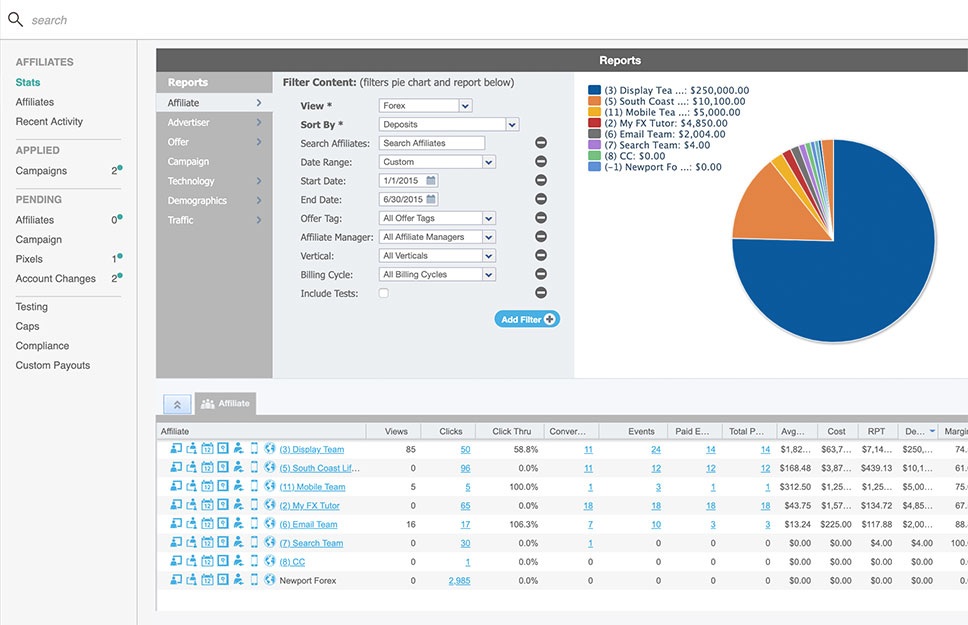
Any Affiliate Manager might recognize what a standard tracking platform reporting interface looks like, and while they are never missing plenty of data, they are quite poor in insights and predictive intelligence. The like of insights that easily translate the data into statements such as "Here is what happened... this is what to do next"
This usually happens because web development teams often work in silos, with no input from data visualization and data science experts.
Solution: To mitigate this, an affiliate network would have to build custom reporting using Business Intelligence tools like PowerBI and Tableau that takes it a step further and actually informs the team on what to do next
Building custom data visualizations represent a great opportunity to turn tabelar data into trends and trendlines, color coded so that the vital information attracts attention. Also, these can be complemented by targets, alerts and notifications and the combined usage of leading indicators and targets.
Problem 2: Affiliate programs and networks sometimes treat all affiliates equally, applying uniform strategies for support, and communication.
Symptom: Inactive affiliates, offers lists emailed that affiliates pay no attention to. Solution: Segment affiliates by past success, vertical, and traffic type.
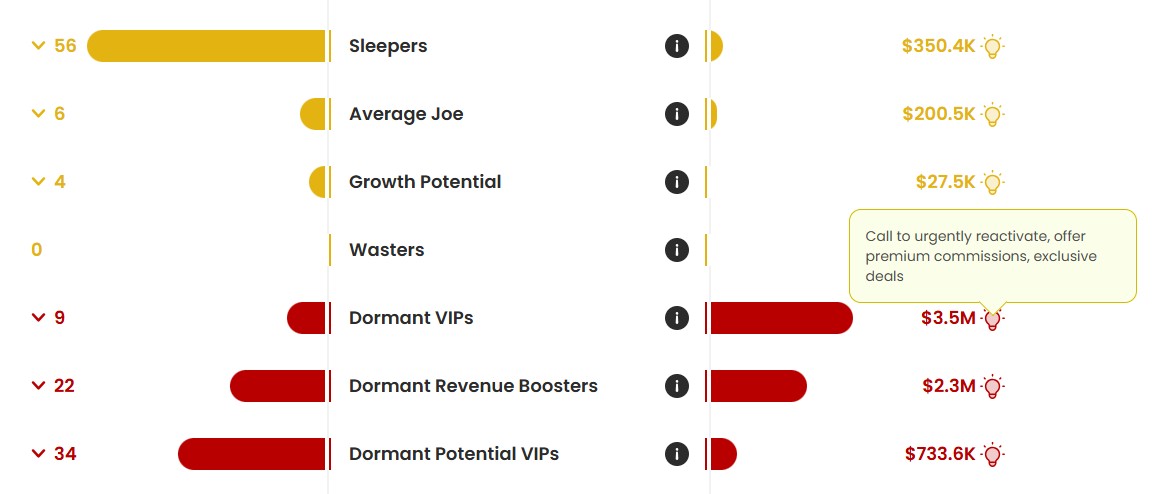
The above affiliate segmentation analysis segments affiliates based on how active they are, how many offers they run and how much revenue per offer they generated.
By combining this information, Affiliate Managers can then isolate segments such as Dormant VIPs (affiliates that used to generate high revenue per offer, run many offers but that are no longer active) and as such chase them and follow up in an attempt to reactivate them and understand why they left in the first place.
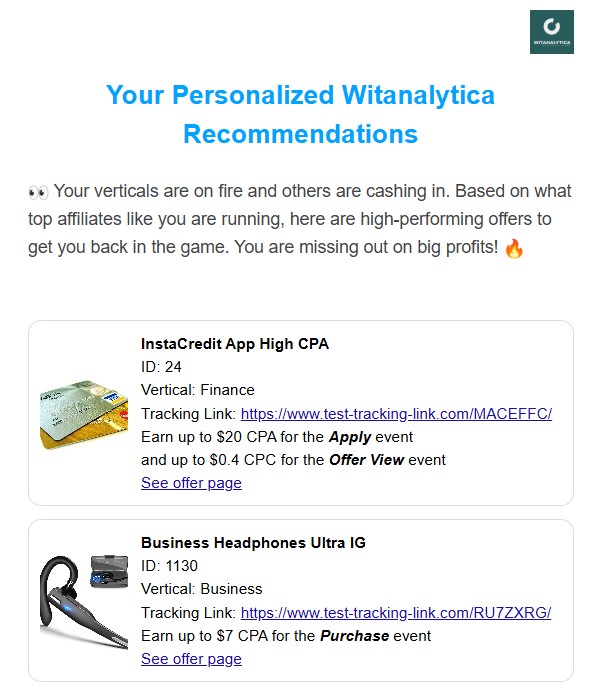
Moreover, having clearly defined affiliate segments opens the door for personalized communications and even using advanced AI tools like the Catstats Recommender System to target each affiliate and affiliate segment with uniquely personalized offers emails
Problem 3: You’re Overpaying for Underperformance
Symptom: You're offering all affiliates the same commission rates despite major differences in AOV, customer lifetime value, or profit margins. Solution: Automated AI agents that adjust commissions to compensate high customer LTV
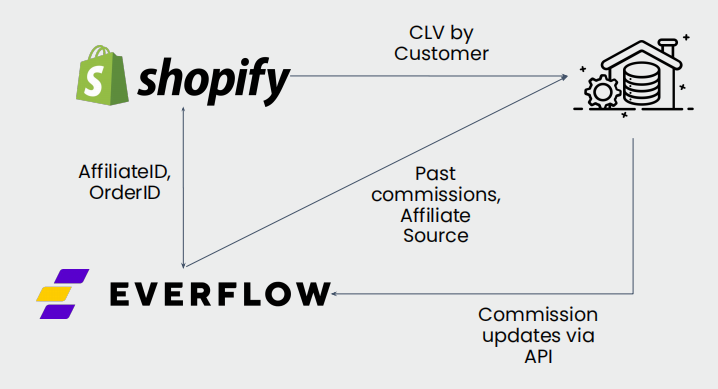
Pictured below is a solution implemented for an ecommerce affiliate network. For each transaction, the brand would communicate back the customer lifetime value tracked from their Shopify instance. Smart algorithms analyze past commissions to calculate ROAS and compare returns across all affiliates.
If the resulted ROAS is competitive, the algorithms would overwrite and set better commissions in the tracking instance. If, on the other hand, the ROAS is poor or negative, the algorithm could dynamically adjust payouts to maintain margin competitiveness.
Unfortunately very few offers combine affiliate tracking with subscription management, but one of the few that do is NATS. Because the platform is keeping track of everything an end customer buys, this means an affiliate program or network can keep track of what they paid in affiliate commissions versus the subsequent purchases.
This means affiliate networks and programs can then see which affiliates bring the highest lifetime value members and, by using advanced algorithms, they can adjust and customize CPAs based on the particular traffic quality of each affiliate.
We strongly consider that offering a standard CPA to all affiliates is not only lazy but also punishes very good affiliates. Subsequently, offering revshare is again a very blunt instrument as we know that an affiliate's contribution lasts for maybe the initial 3-6 months. After that, if customers chose to come back and repurchase your products and services, it is entirely the merit of a good product/service and a great customer experience. So, in our opinion, offering deals like lifetime revshare is a huge disservice to the brand and the company.
Not to mention, in the eventuality a brand is sold, this comes as deadweight and will dramatically drive the brand down. As such, using algorithms to dynamically price commissions to continuously reflect traffic quality is the best solution.
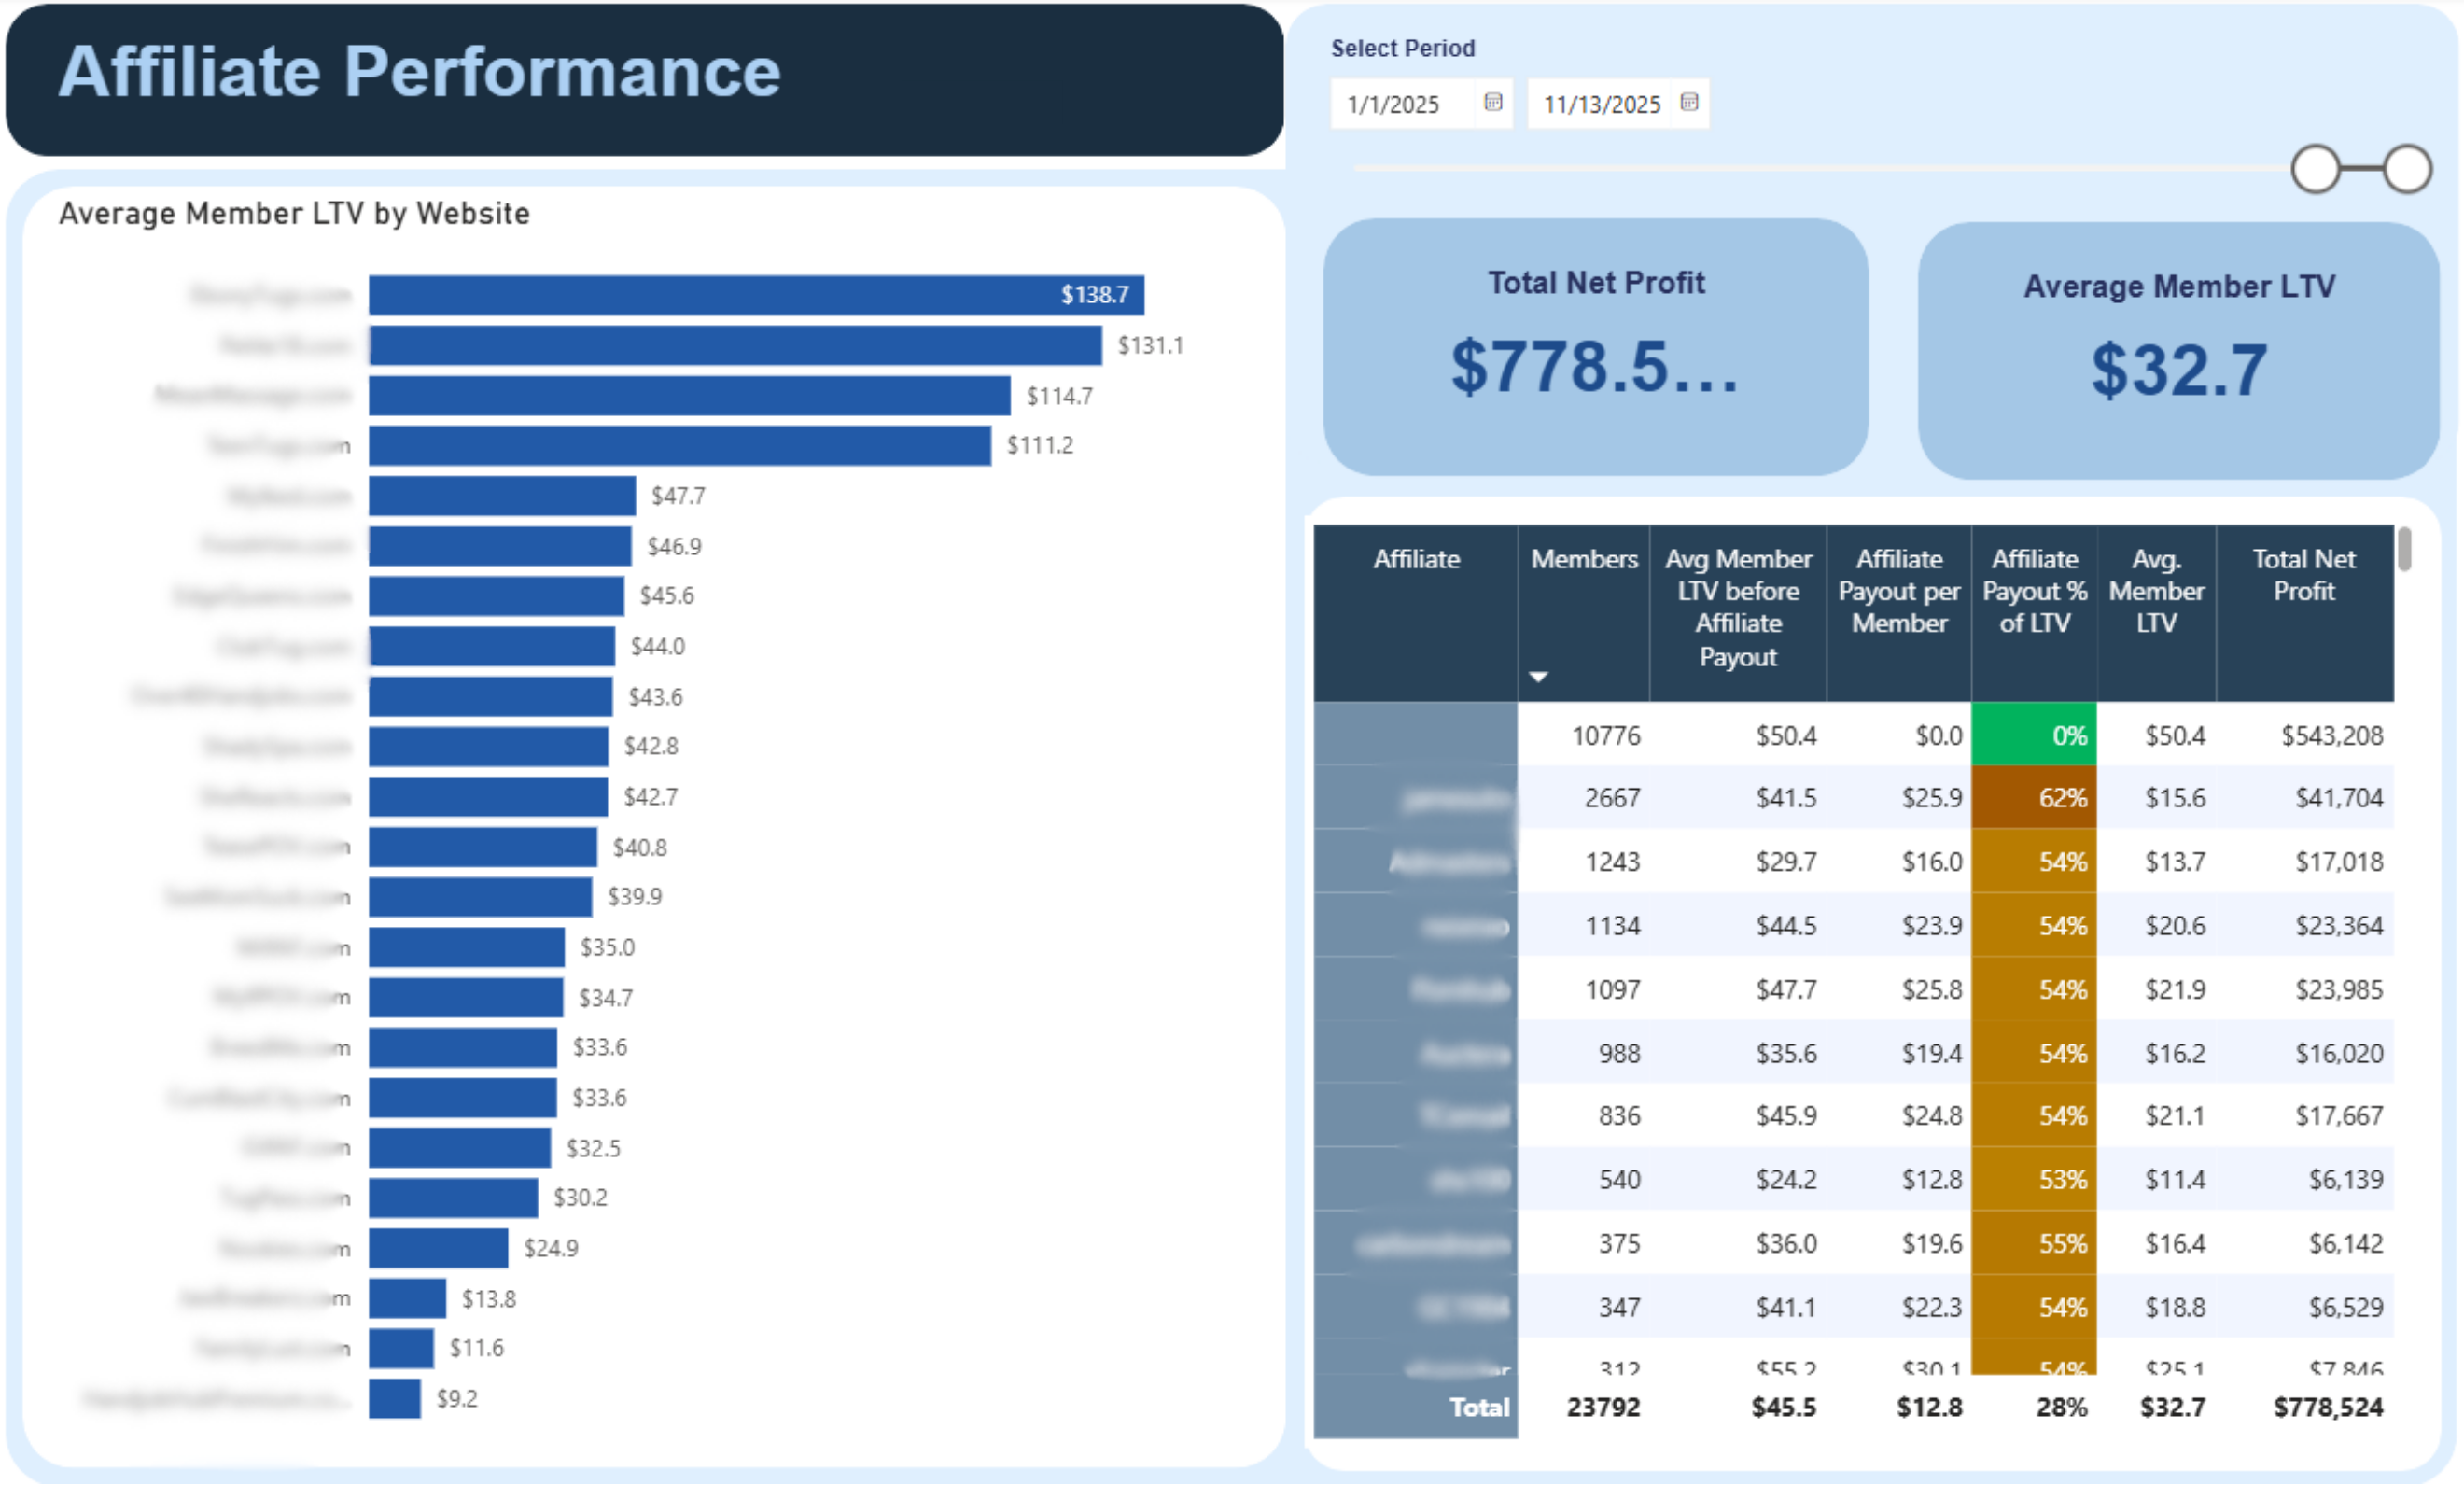
Pictured above is a screenshot from our Catstats for Nats PowerBI dashboards. With this report, affiliate programs can actually see the Average Members Lifetime Profits before and After affiliate Payouts. This program has been paying 50% lifetime revshare for a very long time which is why, after charges, chargebacks and affiliate payouts, they are left with less than 50% of the profits. Not only this, but the dashboard clearly shows that considering the entire 2025 year, the average members lifetime profits are approximately $45 out of which they are left with less than half.
This means they now have 2 strategies:
- if they get a proposal for a cross sell, if they get anything more than $22.5 per member, they should take it and will be more profitable
- they have a budget of $22.5 per acquired new member for SEO or paid media initiatives and will still generate more profit than they are getting from affiliate traffic
Problem 4: The Network and the brand is collecting too little data back from their affiliate channel to learn about audiences
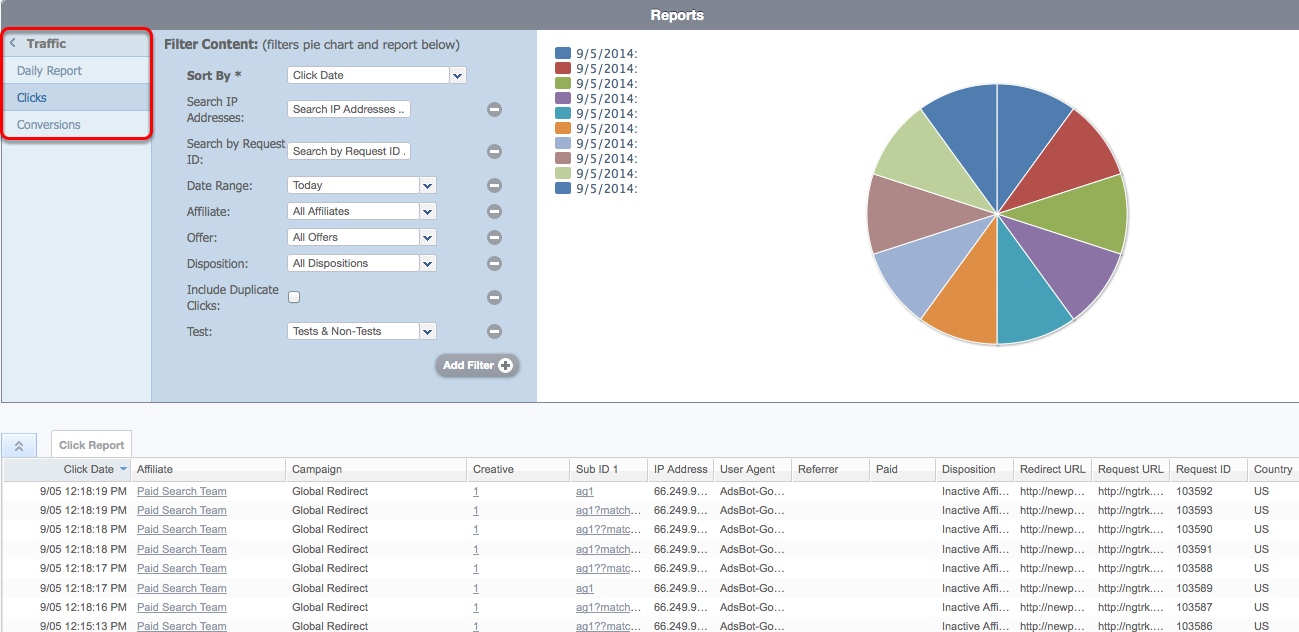
Symptom: The network and the brand has little idea about the working strategies of their affiliates and does very little to help Solution: Use URL tracking links hyper parameters to collect data back from your affiliates to understand which A/B experiments work, which creatives are the best, etc
Affiliate networks can design and implement a standardized tracking structure for their affiliates so that each individual affiliate link placement is parameterized to keep track of the various strategies that are employed.
https://test-tracking-domain.com/offer5/affiliate23? sub1=creative_variant_A& sub2=has_person_in_image& sub3=email_list_3& sub4=color_palette_vivid& sub5=cta_text_discount
Using these types of tracking links can inform the network and the brands about what A/B test experiment works best, which creative variant, what color scheme has the highest conversion rate and which link placement is the most optimal.
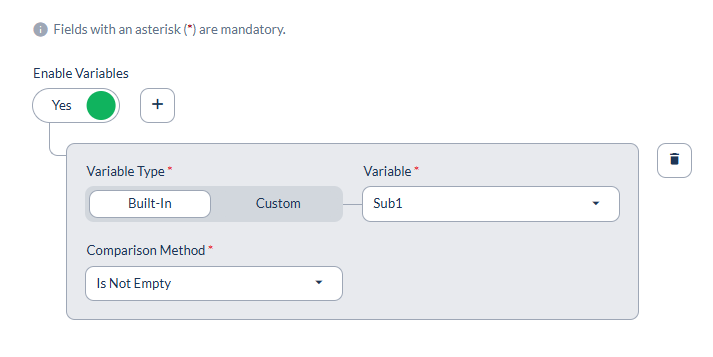
Of course, some of these strategies might be the secret sauce of the affiliate and some might be reluctant to give this away. However, the usage of sub IDs/tracking parameters can be coupled with custom payouts (and some tracking platforms do support, for example, increasing payout by 10% if the sub1 parameter is not null, see picture below)
Problem 5: Affiliate bot traffic is wasting budgets
Symptom: Click injection, cookie stuffing, and fake conversions are eating into your margins. Solution: Anomaly detection for unusual traffic patterns, conversion spikes, and suspicious user behavior.
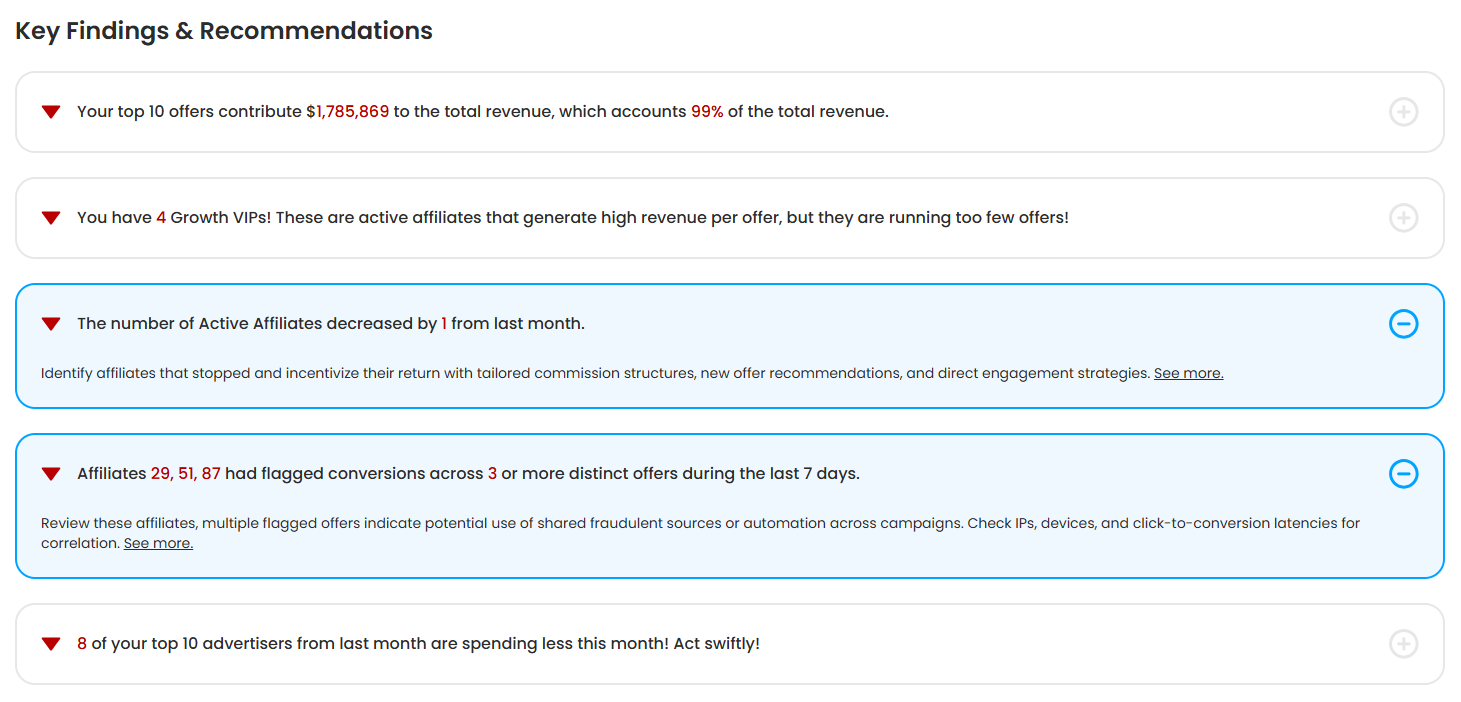
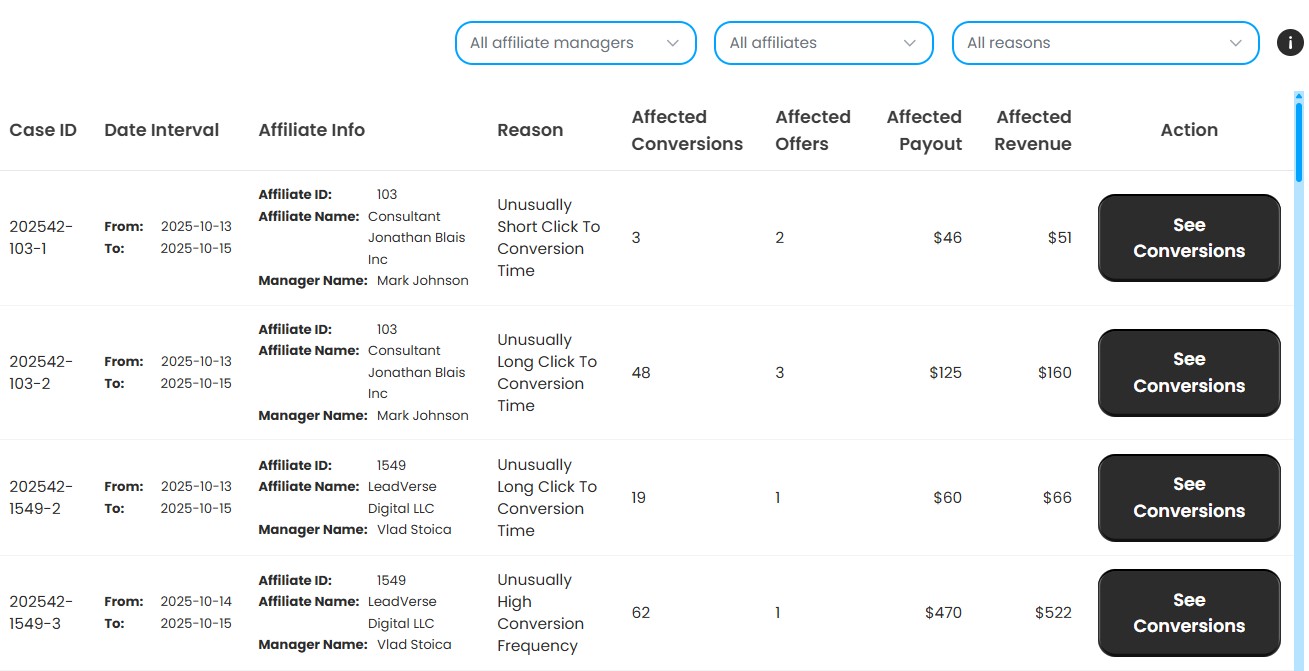
To help tackle this problem, we've built a module that flags conversions that look unusual compared to other affiliates' conversions on the same offer. Here’s what it highlights:
- Conversions that happen too fast (possible bots or cookie stuffing)
- Conversions that happen too late (delayed postbacks or fake fires)
- Affiliates with abnormal device distributions for an offer
- Sudden bursts of conversions happening in a very short span of time (several seconds)
Part 3: The Build vs. Buy Decision
Some networks choose to build analytics in-house. If you're considering this route, here's what's typically involved:
Data Extraction
Connect to your network platform's API (Everflow, CAKE, Affise, etc.) to pull click, conversion, and payout dataData Warehousing
Store and normalize data in a warehouse (BigQuery, PostgreSQL, Snowflake)Transformation & Modeling
Write ETL pipelines to clean, deduplicate, and enrich the data for reportingVisualization & Alerting
Build dashboards in Power BI, Tableau, or Looker — plus custom alerting logic
🧠 Tip: Don't forget alerting (e.g., notify when CR drops 30% or a top affiliate goes inactive)
💸 Estimated yearly cost: $20K–$50K for software and infrastructure + $100K–$150K in salaries for a data engineer and a BI specialist (averaged between EU and US markets)
Building in-house gives you full control, but it requires ongoing maintenance, dedicated headcount, and months before you see results.
Part 4: The SaaS Alternative
For teams that want to focus on growing their network rather than building data infrastructure, CatStats.ai offers a ready-to-use subscription:
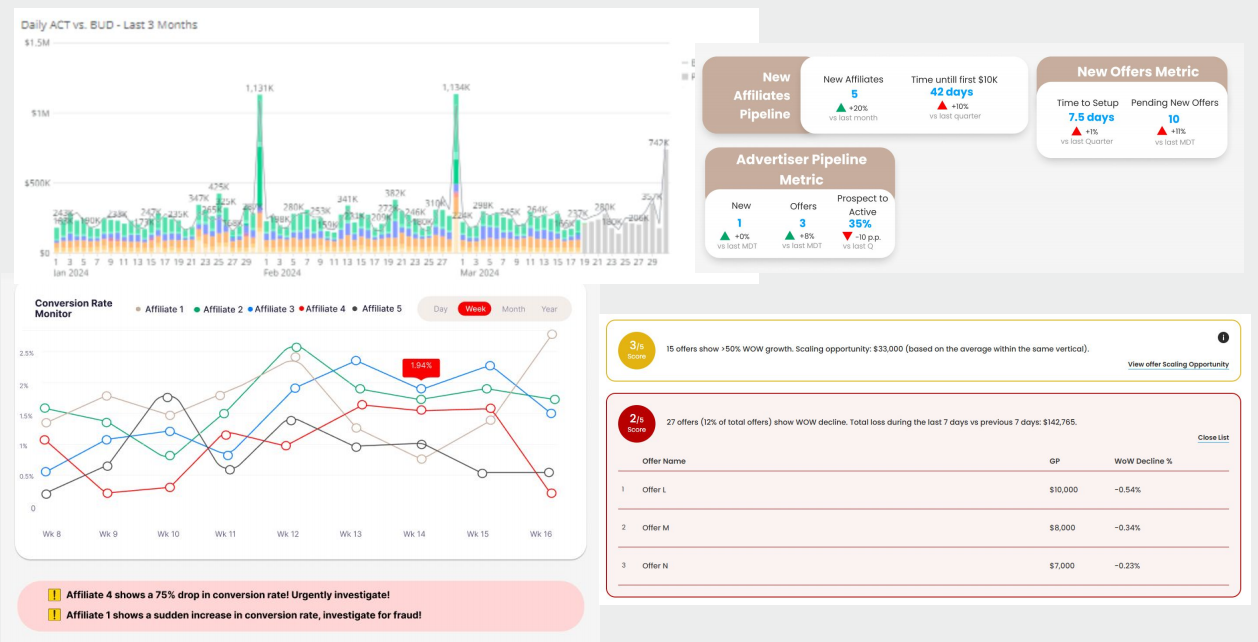
- Revenue, profit, affiliate and advertiser performance dashboards
- AI-powered offer recommendations per affiliate, based on historical performance patterns
- Network health scores
- Automated alerts for fraud, CR anomalies, and inactive top affiliates
One network covered its monthly CatStats fee in just 2 days by activating hidden revenue opportunities.
Part 5: Future-Proofing Your Analytics Stack
Smart networks are already exploring:
- Predictive revenue projections (by affiliate, GEO, source)
- Offer fatigue detection (based on CTR and CVR drop-offs)
- AI-generated affiliate recommendations
- Seasonality-adjusted pacing models
Final Checklist: Is Your Network Flying Blind?
- You don’t have a single source of truth for all affiliate data
- You still use spreadsheets to segment affiliates or track ROAS
- New offers don’t reach the right affiliates on time
- You’re unable to confidently explain dips in revenue
- You are not sure if Affiliate Managers are logging in to check affiliate performance, pull links and distribute them
If you checked 3 or more, your analytics stack is likely holding you back.
Ready to level up?
Let’s turn your tracking data into a growth engine, not a reporting burden.